
Adding Contours, part 1
2014-04-16 00:00:00Here we are (finally) at the next part of our software tutorial. Contours - the one thing that caused the most trouble and anxiety for the last class. The good news is that it's pretty easy for most of us! There's a lot of free data out there for terrain. For the lucky ones who can download a topo map of their site (I'll explain below) contours are really easy. For others, we have a couple of fallbacks to work with. This is also the tutorial where we'll start to get into more of what inkscape can do. I went back and forth on the format for this several times and finally decided that I needed to break it into a few pieces, so here's the outline of the next few steps:
- The easy way - when you have access to a topographic map. We'll learn the basics of shape drawing in inkscape here, so even if you can't get a topo map I encourage you to follow along with some random property for this part. This edition of the tutorial will stop here, the next two will come soon.
- The medium way - there's a lot of terrain data available in google earth that isn't easy to get at in other ways. Unfortunately, I don't know of a way to get google earth to show contours, so we have to make them ourselves with a simple, but tedious, process. Note: for those using sketchup, there's a shortcut for this here.
- The hard way - measuring contours on the actual land. This is a pretty big hassle, and prone to error without some pretty good techniques. There are a couple of things we can do though, to get at least a decent concept map, which is good enough for this level of design.
At the end of this tutorial, I'm going to put a quick reference for the commands we cover in inkscape so that you can find them again without reading through the whole post.
Step one - managing expectations!
Measure with a micrometer, mark with a crayon, cut with a chainsaw. - Unknown engineer
Before we get started, I need to say a few words about precision and accuracy. The quote above this section is from a previous life where I worked as a mechanical engineer. We'd say it to make fun of things that had impossibly tight tolerances, particularly in cases where it really didn't matter. It definitely applies here, with contours as well.
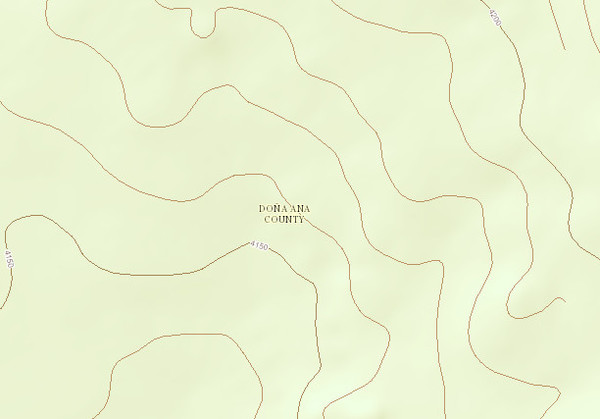
When you get on a site like nationalmap, they have these contour lines that are hair-thin no matter how close you zoom in. It really makes you think they've measured the ground down to the nearest inch, just because of the way it's drawn. The reality is much less awesome. Here's an example of a topographic map (zoomed way in) from national map:
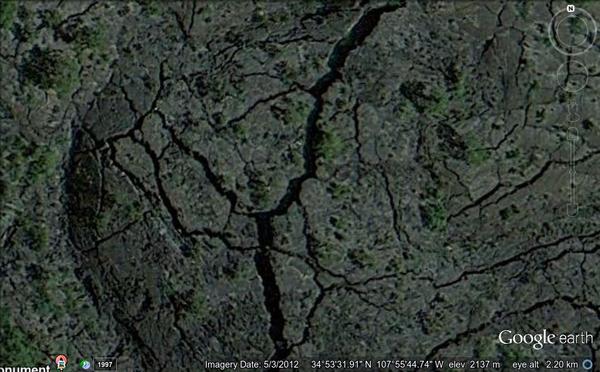
I've been to that place, and I can assure you that it's nothing like you might think from the contours. Here's an aerial photo from Google Earth:
And here's a photo from ground level in the same park:
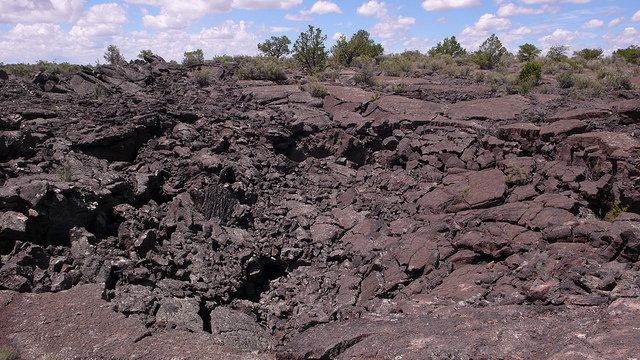
The problem is that contour maps are made by finding points on the landscape that are the same elevation and then connecting them with smooth curves. It's impossible for them to ever capture all of the detail of a landscape, and sometimes they can be extremely misleading (i.e. El Malpais).
I'm not pointing this out to rag on contour maps - they're incredibly useful. However, what I want to emphasize is that there is no such thing as a "correct" contour map - they are all conceptual, they just have different degrees of error. So if you can't get access to pristine contour data, don't worry about it. The real purpose of the conotours on your map will be to position things relative to each other. You are going to specify things like "the pond goes above the hydrant," or "these five features are all on the same level." As long as you're in the ballpark, the actual positions will be sorted out when you implement the design anyway regardless of what your map says.
Okay, phew. Hope that didn't scare anybody off, let's get into the good part!
Getting contours on your map, the easy way
Okay, so we're going to start out with the easiest case - you have lucked out, and you can download a topographical map of your property. Here are my favorite places to look for this:
- The National Map Viewer (US Only). For places in the US, this is really the best I've found for getting contour lines that fit your map. You can even overlay them on an aerial photo so that everything is automatically lined up! We'll do the screenshot and crop process just like with the background image from last time.
- ESRI's World Topographic Map Viewer. This has some good data for lots of places around the world, so you might be lucky and get some decent data for your site here if you're outside of the US
- Fernando Spalding sent in this great link to a site that gives you topo data with a UTM coordinate grid which makes it much easier to keep everything lined up: MappingSupport.com Make sure you use the menu at the upper right to select the right topo data view (for me it's "t4 Topo High USA")
- Printed topo maps. If you can get a printed map of your site, you can do a sneaky trick: Take a digital photo of the map, then crop out your site on the computer just like you did for the background image.
- mytopo.com has pretty good maps for the US and Canada. If you look at their online maps page, you can type in your address and see what you get. Once again, you'll screenshot and crop to get the topo lines.
Okay, so at this point, you should have found your property on one of those sources (or if you have more, please share!). Zoom in and make your site as big as you can get it on the screen, then take a screen shot. If you have a really big site, you can use the method of taking multiple screenshots and stitching them together. One way or another, you want to end up with a topographic map of your site as an image.
Getting the topo data into inkscape
The next step is to get the topo map into inkscape in a way that it's usable for the rest of the design. We'll do this in two steps: First, we'll import the map image you just made and overlay it on the background image. Second, we'll trace over the contours with a bezier curve so that we get the contours into a form that's easy to tinker with inside inkscape (and so that the topo map isn't cluttering our view). After we have the contour lines drawn in with curves, we can get rid of the topo map layer as it's served its purpose.
- Open your drawing from last time in inkscape
- Import the topo map image (ctrl+i or file->import on the menu)
-
Use the bezier tool to outline your property and mask off the parts that aren't on the site (see the previous tutorial) for details.
-
Fit the map onto your background image. At this point, you'll have two objects in inkscape - the background image and the map image. We're going to move the map around and scale it up or down until it fits just right over the background image. Remember to hold ctrl down while you scale so that the map doesn't get distorted! If you used the national map data, you can probably skip this step because they did it for you (pick the "Imagery Topo" button at the top).
-
Press F1 or click on the arrow to use the select tool, then pick the topo map image. Make sure it stays selected for the next step.
-
Push ctrl+shift+F to open the "Fill and Stroke" window. At the bottom of that window, there is a slider with the label "Opacity %". You can slide this to the left to make your map transparent, so that you can see the background under it. If your topo map is under your background, you can raise it up in the stacking order by pushing page up while it's selected.
-
Now, drag the topo map over the top of the background image and move it around, looking for distinguishing features that line up between the two maps. Topo maps will often have little iconic representations for buildings and bodies of water, so if you can line them up that will get your scale and orientation right. It won't be exact, but remember we're shooting for the "good enough is perfect" rule here.
-
If your site doesn't have any aligning features that you can distinguish, you may have to zoom out a ways with your background and topo imagery until you can find stuff to line up. Roads, towns, bodies of water, etc. all make good alignment features at a larger scale. If there are bodies of still water that aren't shown on the topo map, sometimes it helps to remember that the edge of the water is perfectly on contour, so you can make the contour map fit by lining up contours on it so that they're parallel with the edges of still water. This doesn't work with flowing water (like a stream), because flowing water is moving down hill and won't stick to a contour line. After you get them lined up at the large scale, you can go back and trim the images back down to just your site and things should be pretty good.
-
-
It's normal for there to be some error between the topo map and the aerial photo. This is just a feature of using different data sets and fitting them together. Get it to the point where it looks like you think it should - your knowledge of the site will have to play a role here.
Here's a sequence of images showing me going through this process for my property:
Inserting the topo map from nationalmap:

Trimming off the extraneous stuff. You can see the outline in the image above, and the result below.

Inserting the background image (again from nationalmap).

Setting the opacity (transparency) of the topo map so that I can see through it. Note that you can see the edge of the drawing canvas through the topo map now. Also, the "Opacity %" slider is down from 100 in the Fill and Stroke window. You can also see that the topo image of the property is bigger than the aerial photo. I'll fix this in the next step by scaling it.

Now I'm overlaying the topo image on top of the aerial photo. Note that it's been resized somewhat from previous pictures here, so that it fits the property boundaries. The green areas on the topo map concide with the tree line and pond approximately.

Draw in the contours
The last step for this tutorial is to use the bezier tool to draw over the contour lines so that they're smooth even when we zoom in. If we didn't do this step, our contours would be grainy when we zoomed in on the map, like the "before" in the picture below. We'll make them smooth so that no matter how close we zoom in they look like the "after." The other reason to do this is so that our contours can be visible without obscuring other stuff in the drawing (the rest of the topo image isn't really helping us, and it blocks out the background even if it's transparent).

- Create a new layer called "contours" or something like that.
- Press ctrl+shift+L to open the layers dialog
- click the + button
- Type your layer name in the box, set the position to "Above current" and press "Add"
- Make sure the new layer is active by clicking on it. A note on layers - if you need to change the layer of something that's already in the drawing, you can do it by first selecting the thing you want to change, then pressing shift+page up or shift+page down. If you have the layers dialog open you can see what layer it moves to because it'll become the new active layer.
- Zoom to where you can see a whole contour line on your map. To zoom, you can click the magnifying glass in the tool bar to pick the zoom tool. You can then click to zoom in, shift+click to zoom out, or you can click and drag to zoom to a rectangle. You can also zoom in and out by holding ctrl while you scroll your mouse wheel, or by pressing + (plus key) or - (minus key) on the keyboard.
- Pick the bezier tool (or press shift+F6), and click once on one end of the contour line. If the contour is a closed loop, you can pick anywhere on it you want.
- Now move along the line, clicking on the contour periodically to put more points on it, until you've covered the whole contour. For places where the contour is relatively straight, you can use fewer points, and where it's tightly curved, use more. At this point, the contour will look rough and segmented. That's what we want - we'll smooth it out in the next step. Try to use the smallest number of points you can while still getting the shape pretty close to right. You can add and remove points on the bezier curve later too, so if it's not perfect don't worry, it's easy to fix.
- To finish the curve, press enter or double click the last point.
- Now we're going to switch to "node editing mode." This allows you to tweak
the curve you just drew by moving its individual points around. To get into node
mode, you can either press n on the keyboard, or pick the node tool from the
tool bar (it looks like this:
 ).
). - The next thing we'll do is smooth the line. Click on your curve to make sure it's selected, then press ctrl+a to select all of the nodes. When they are all yellow, press shift+s to smooth them. Your curve should now look nice and smooth. If you want, you can now drag the points around to make it fit better. Each point will also have a couple of lines poking out of it with circles on the end. Play around with them to see what they do - they let you change the way the line curves between points.
- Now repeat steps (2) through (7) for all of the contours on your map, and when you have it like you want, you're done!
- After you've drawn in all of the contour lines, I recommend either deleting
the topo image that you used for them, or at least putting it on another layer
that you can switch off separately from the lines you drew. The reason is that
it obscures the background aerial photo, which will be important for future
steps in the design process.
- If your layers dialog isn't open, press ctrl + shift + L to open it
- Create a new layer, named "topo image" or something
- Use the select tool (F1) to pick the topo image, then press shift+page up or shift+page down to move the image so that it's on the new layer you made.
- Click the picture of the eye by the new layer in the layers dialog to turn off the layer (make it invisible)
Inkscape quick reference
Here's what we covered from inkscape this time around:
- Pick objects
- Use the select tool (press F1 or pick the arrow tool)
- click object. To pick several, hold shift while clicking them.
- Change transparency of object: Pick the object, press ctrl+shift+F, then move the slider labeled "Opacity %"
- Create new layer:
- press ctrl+shift+L
- press the '+' button
- name the layer and press "Add"
- Move objects to a new layer
- Open the layers dialog (*ctrl+shift+L)
- Select the object(s)
- Press shift+page up to move it up a layer, or shift+page down to move it down
- Toggle layer visibility
- Use the little eyeball icon next to the layer name to make the layer visible or not. Each click switches it from one to the other or back.
- Draw smooth curves:
- press shift+F6 or click the bezier tool
- Click once for each point on the curve you want
- Press n or pick the node edit tool, or double click in select mode to enter node mode
- Press ctrl+a to select all nodes (or you can pick individual nodes if you don't want them all to be smooth - remember to hold shift while you click if you want to pick several things at once)
- Press shift+s to smooth the selected nodes.
- Move objects up and down in the stacking order: page up or page down key.
- Zoom in and out
- Press the '+' and '-' keys on the keyboard
- Hold ctrl while scrolling the mouse wheel
- Press the magnifying glass button and either click, shift+click, or drag a rectangular box.
Other helpful references (updated as they come in)
- New Zealand's topographic map (20m contours): topomap.co.nz